数据 - 多个时间框架#
有时会使用不同的时间框架进行投资决策:
每周评估趋势
每日执行入场
或者是5分钟对比60分钟。
这意味着在 backtrader 中需要组合多个时间框架的数据以支持这些组合。
原生支持已经内置。用户只需要遵循以下规则:
具有最小时间框架(因此具有更多的条目数)的数据必须是添加到Cerebro实例的第一个数据
这些数据必须被正确的日期时间对齐,以使平台能够理解它们
除此之外,最终用户可以随意在较短/较长的时间框架上应用指标。当然:- 将指标应用于较大的时间框架将产生较少的条形图
平台还将考虑以下因素:
较大时间框架的最小周期
最小周期可能会导致在将策略添加到Cerebro之前,需要消耗较小时间框架条形图的几个数量级。
内置的 cerebro.resample 将用于创建较大的时间框架。
以下是一些示例,但首先是测试脚本的原始代码。
    # Load the Data
    datapath = args.dataname or '../../datas/2006-day-001.txt'
    data = btfeeds.BacktraderCSVData(dataname=datapath)
    cerebro.adddata(data)  # First add the original data - smaller timeframe

    tframes = dict(daily=bt.TimeFrame.Days, weekly=bt.TimeFrame.Weeks,
                   monthly=bt.TimeFrame.Months)

    # Handy dictionary for the argument timeframe conversion
    # Resample the data
    if args.noresample:
        datapath = args.dataname2 or '../../datas/2006-week-001.txt'
        data2 = btfeeds.BacktraderCSVData(dataname=datapath)
        # And then the large timeframe
        cerebro.adddata(data2)
    else:
        cerebro.resampledata(data, timeframe=tframes[args.timeframe],
                             compression=args.compression)

    # Run over everything
    cerebro.run()
步骤:
加载数据
根据用户指定的参数对其进行重新采样脚本还允许加载第二个数据
将数据添加到cerebro中
将重新采样的数据(更大的时间框架)添加到cerebro中
运行
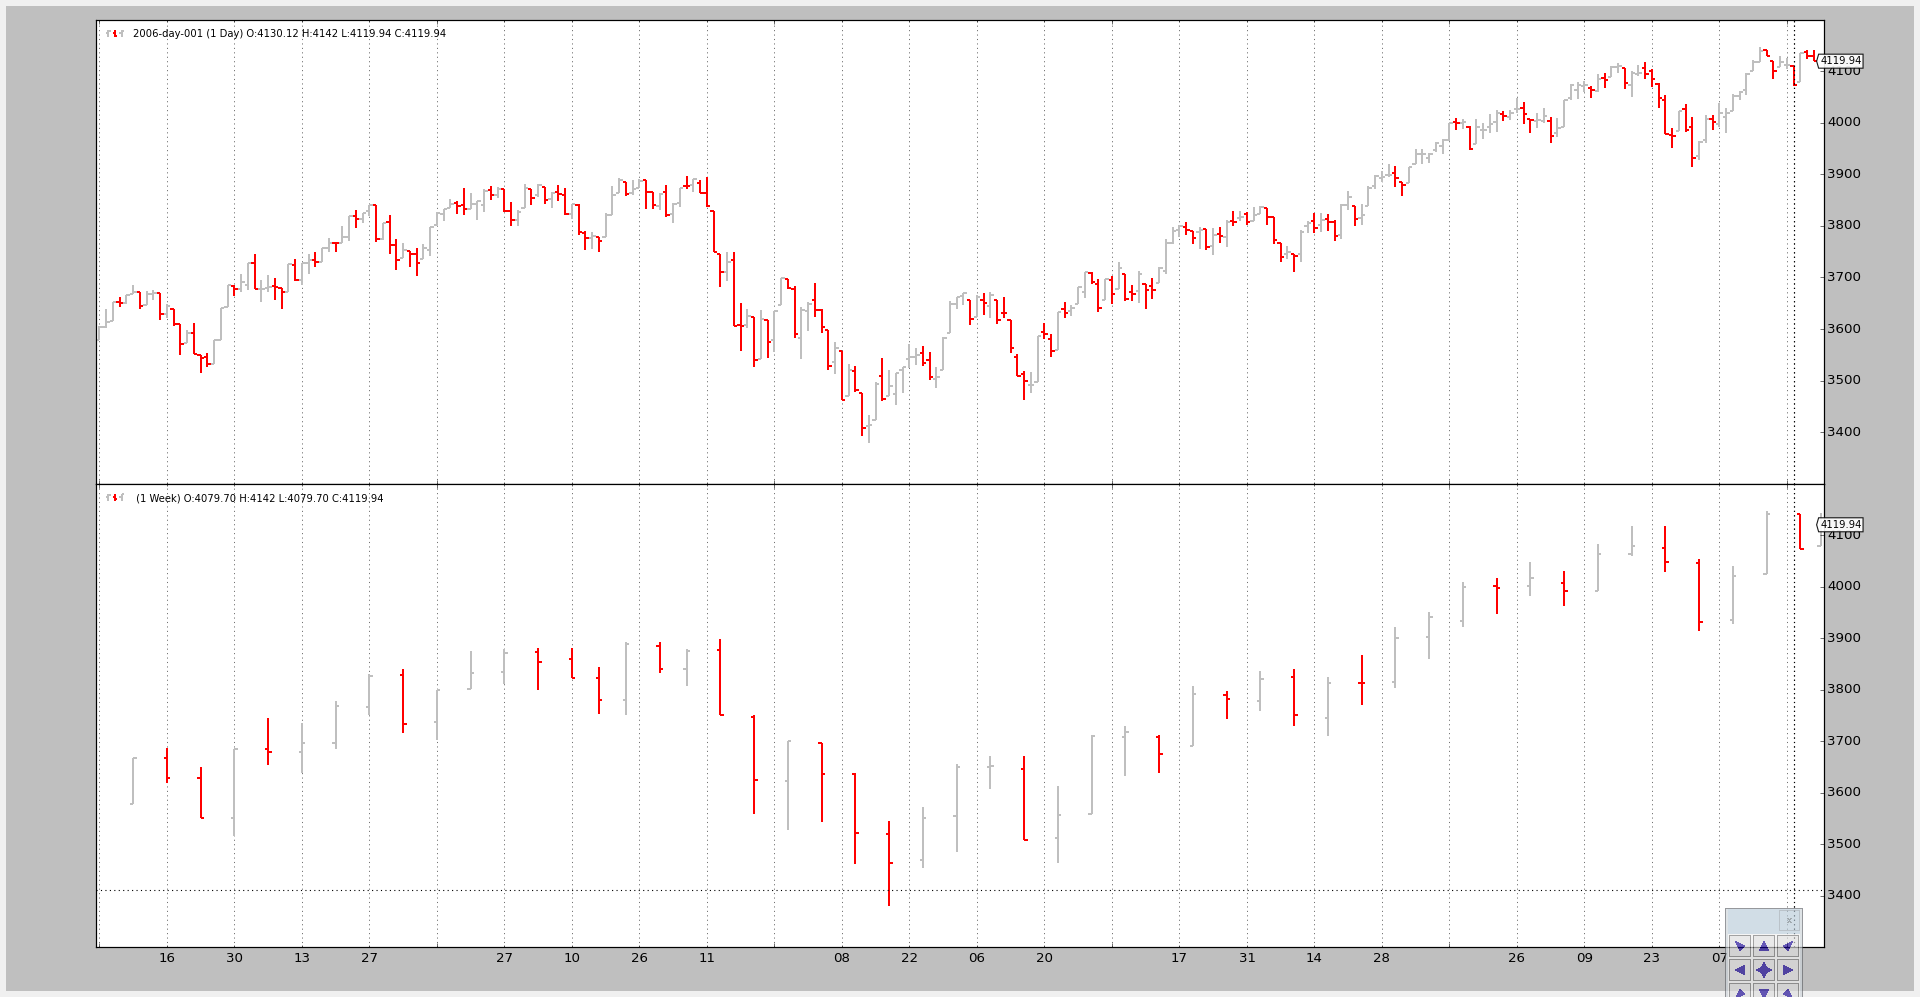
示例1 - 每日和每周#
调用脚本:
$ ./multitimeframe-example.py --timeframe weekly --compression 1
输出的图表为:

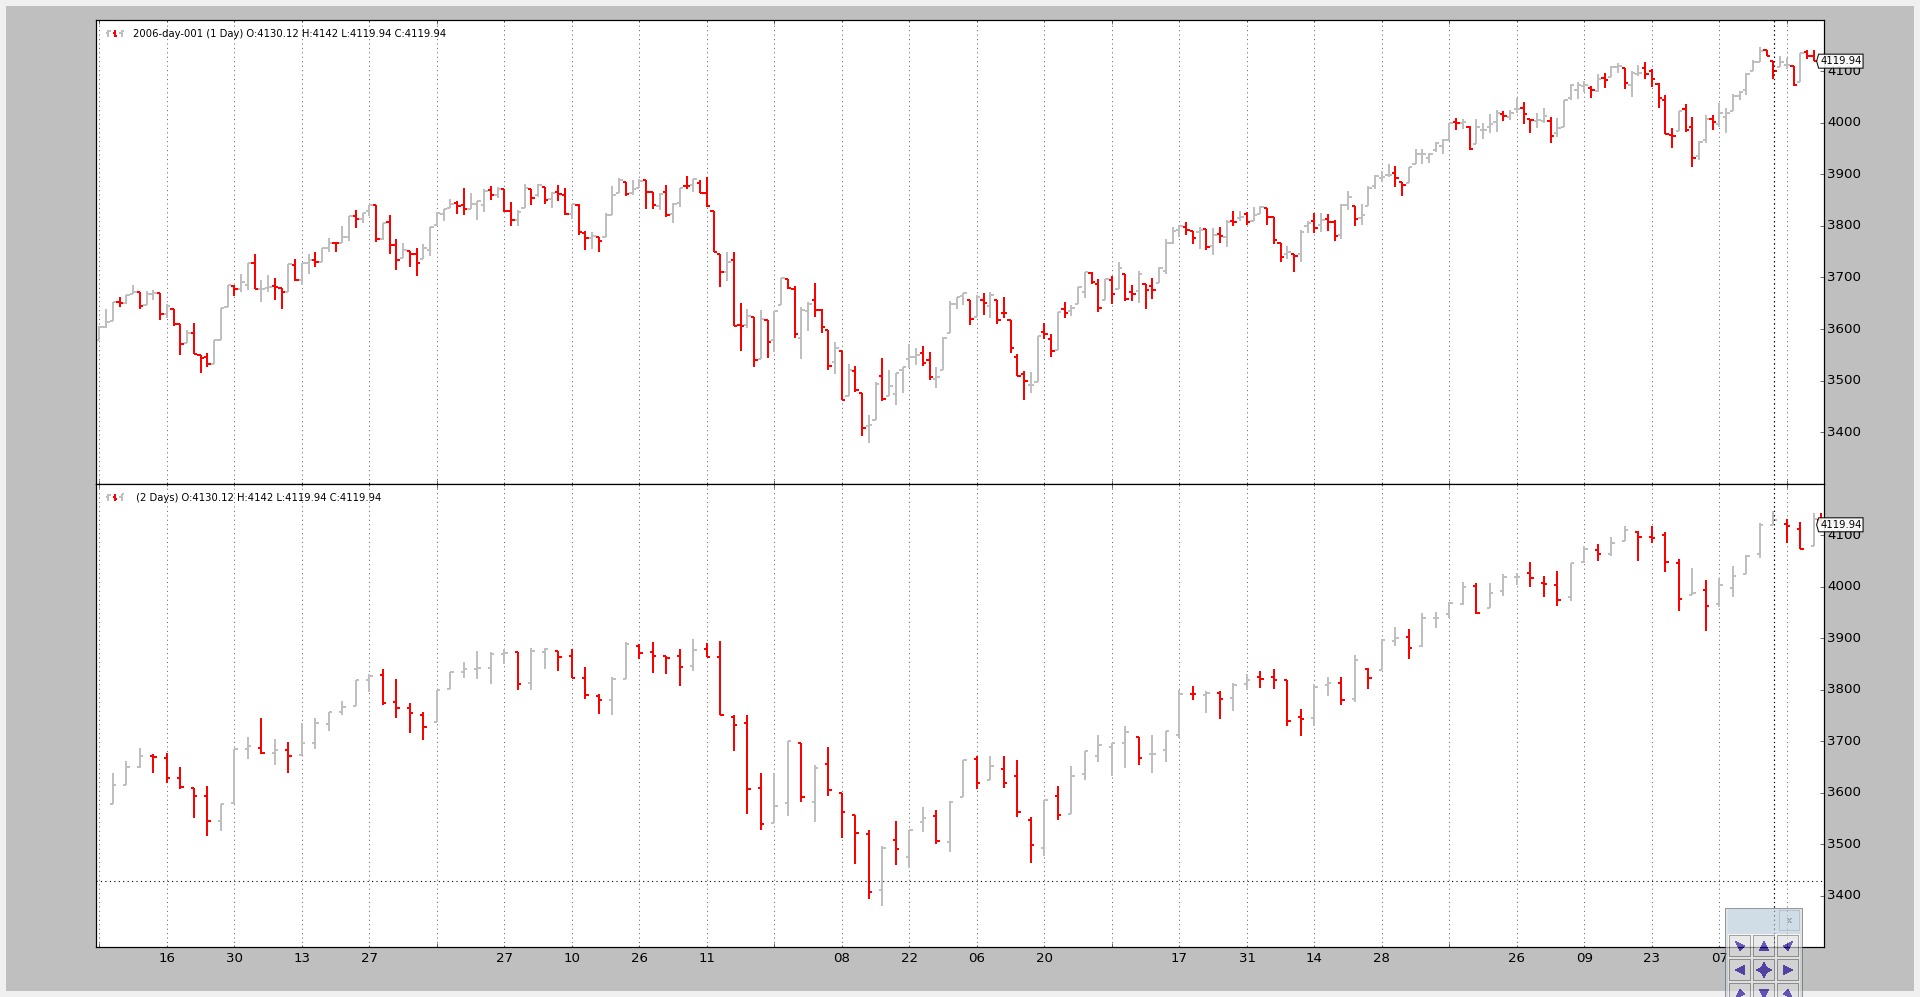
示例2 - 每日和每日压缩(2个柱子合并为1个) ====================================脚本的调用:
$ ./multitimeframe-example.py –timeframe daily –compression 2
以及输出的图表:

示例3 - 带有SMA的策略#
尽管绘图很好,但关键问题在于展示更大的时间框架如何影响系统,尤其是从开始点开始。
该脚本可以使用 --indicators 参数来添加一个策略,该策略在较小和较大的时间框架数据上创建简单移动平均数的 周期为10 。
如果只考虑较小的时间框架:
next将在10个柱之后第一个调用,这是简单移动平均值需要产生一个数值的时间
但在这种情况下,较长的时间框架(每周)会延迟对 next 的调用,直到每周数据上的简单移动平均线生成一个值,这需要… 10周。
脚本覆盖了只被调用一次的 nextstart ,它默认调用 next 以显示第一次调用的时间。
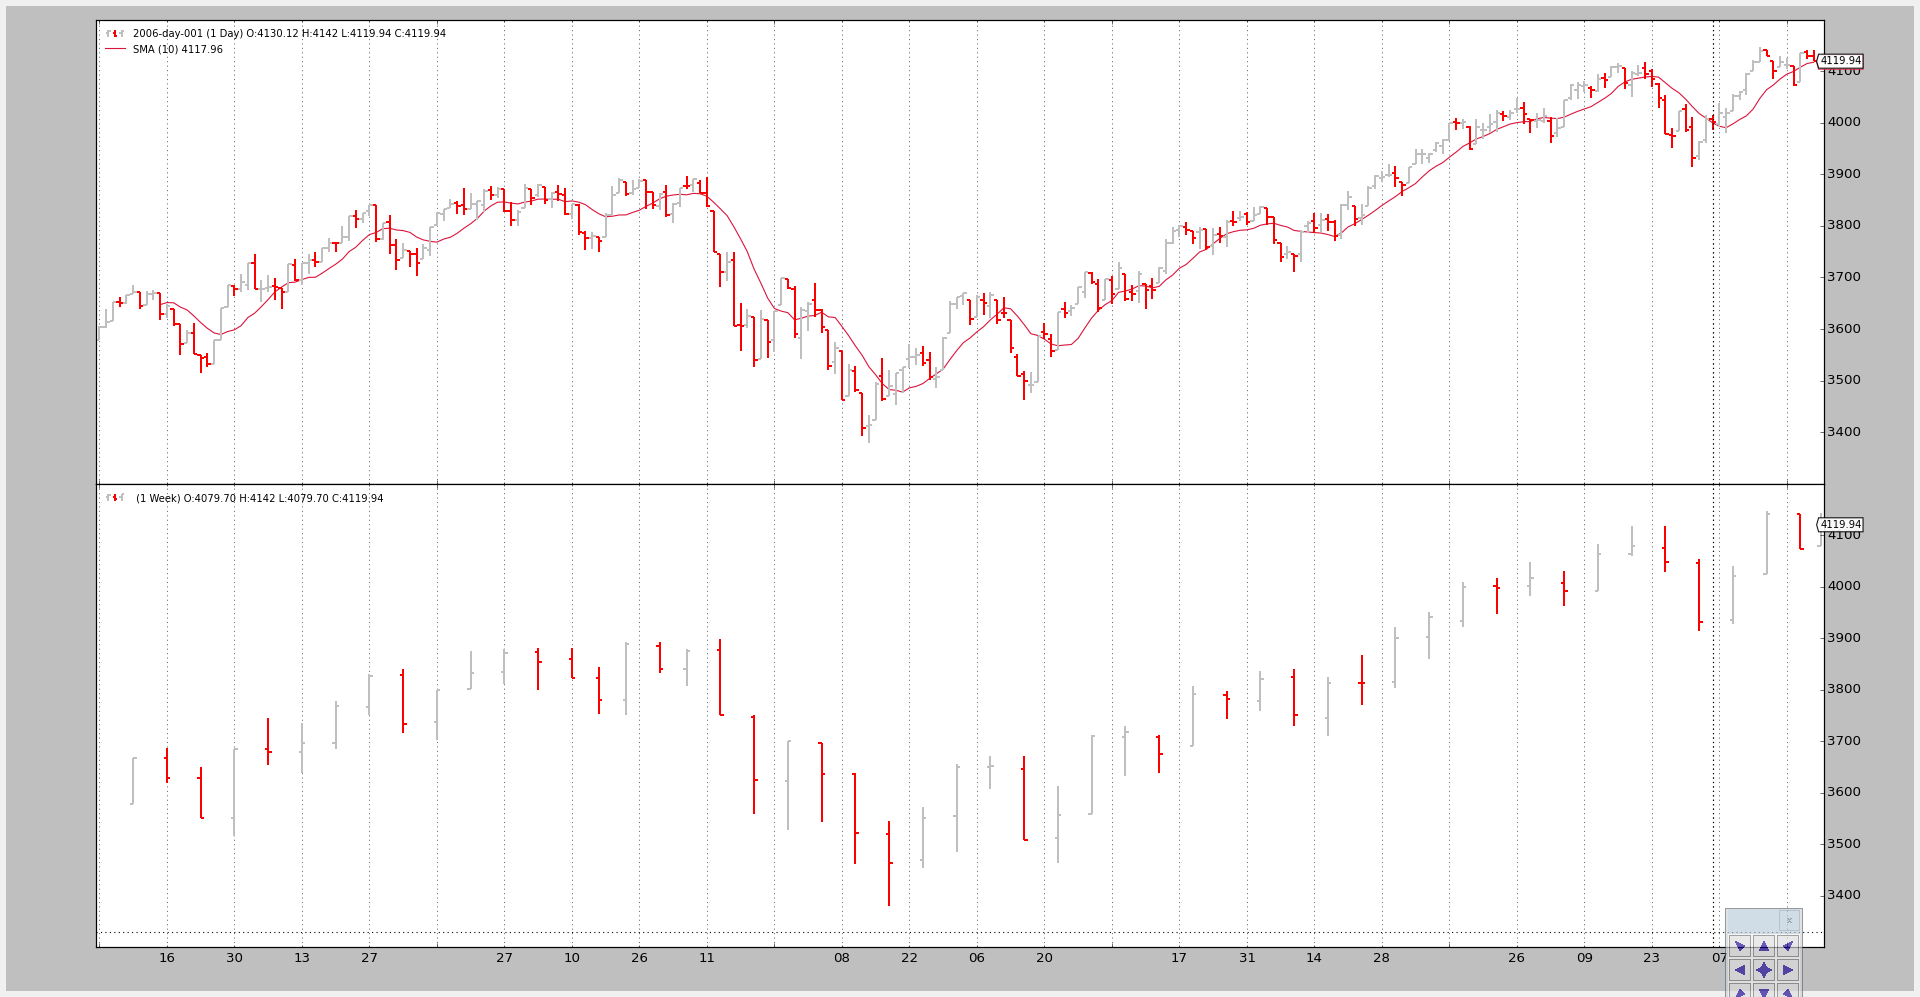
调用1:#
仅在较小的时间框架(每日)上计算简单移动平均线。
命令行和输出:
图表如下。

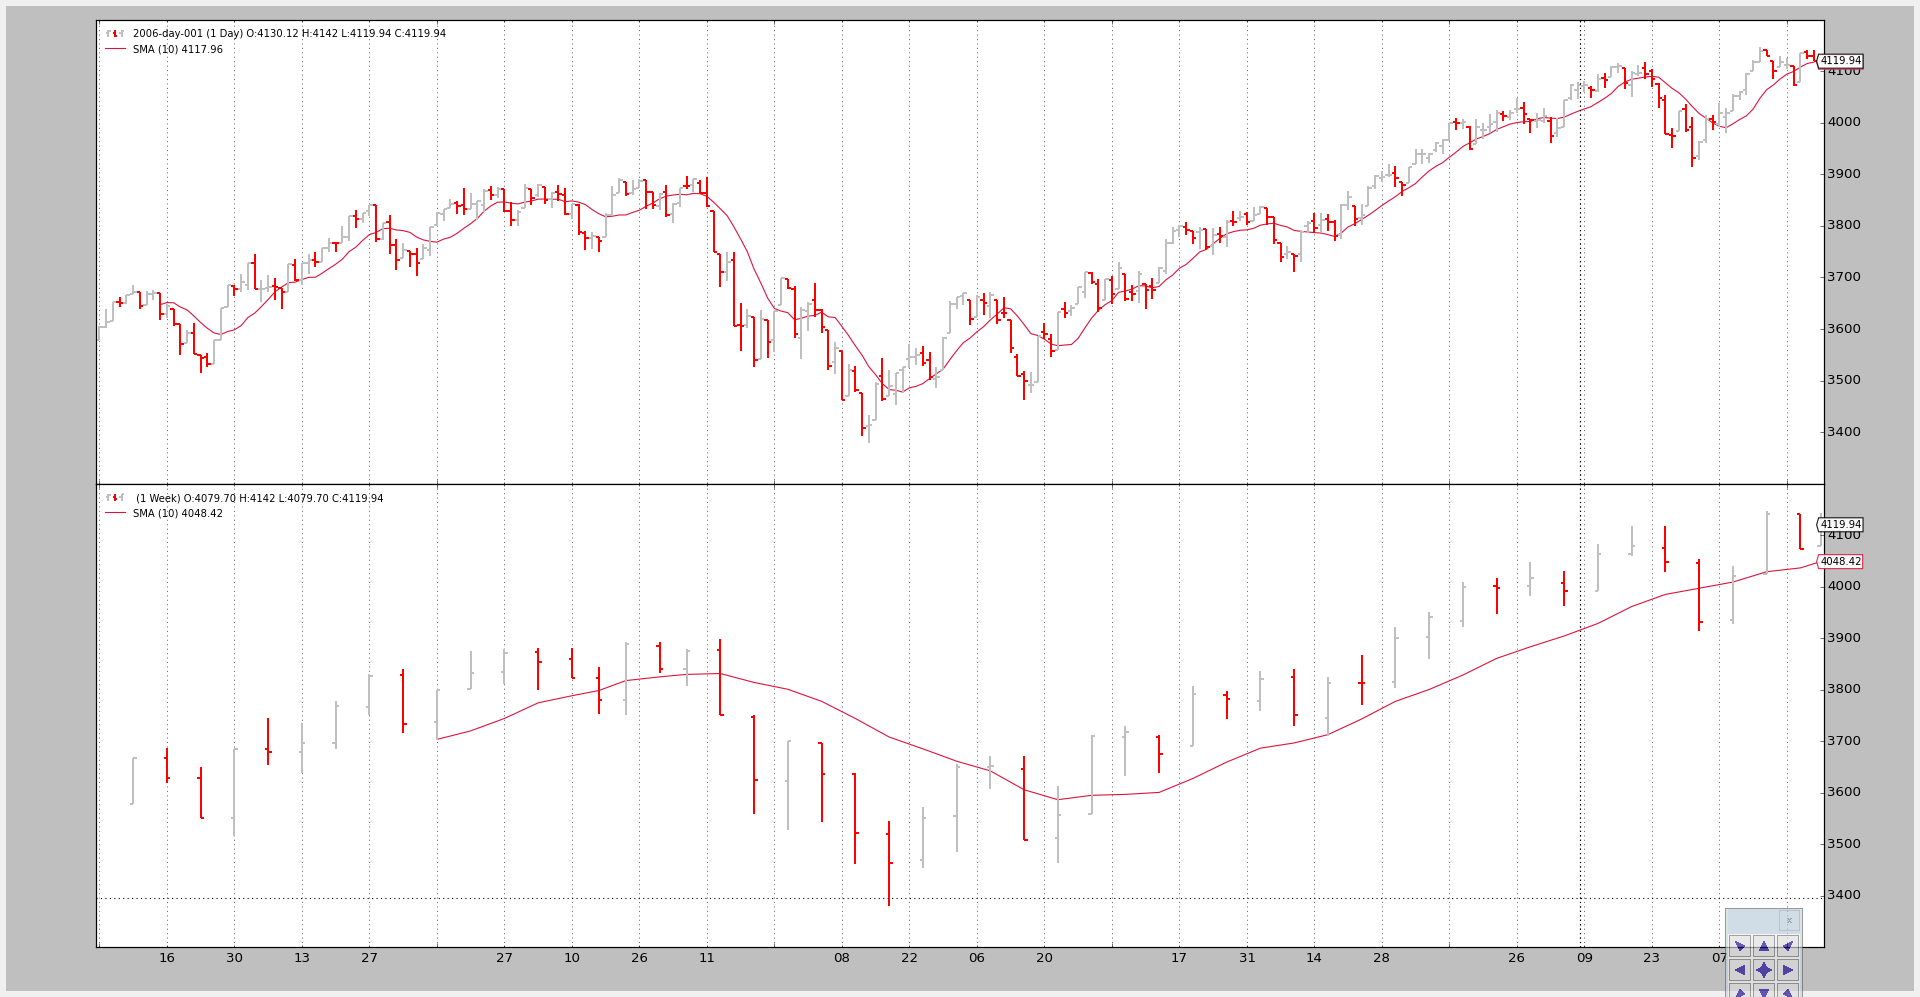
调用2: ——-两个时间段都使用简单移动平均
命令行代码:
$ ./multitimeframe-example.py --timeframe weekly --compression 1 --indicators
--------------------------------------------------
nextstart 在长度为50时调用
--------------------------------------------------
--------------------------------------------------
nextstart 在长度为51时调用
--------------------------------------------------
--------------------------------------------------
nextstart 在长度为52时调用
--------------------------------------------------
--------------------------------------------------
nextstart 在长度为53时调用
--------------------------------------------------
--------------------------------------------------
nextstart 在长度为54时调用
--------------------------------------------------
有两点需要注意:
策略不是在 10 个周期后被调用,而是在50个周期后首次被调用。
这是因为在更长的(每周)时间段上应用的简单移动平均在10周后才产生一个值… 也就是10周 * 每周5天 … 50天
nextstart被调用了5次而不仅仅是1次。这是将时间段混合并在(这种情况下只有一个)指标应用于更长时间段的自然副作用。
更长时间段的简单移动平均在消耗5个日线条之时产生了5次相同的值。
而因为时间段的开始由更长时间段控制,
nextstart被调用了5次。并且这张图。

结论#
多时间框架数据可以在 backtrader 中使用,无需特殊对象或调整,只需先添加较小的时间框架。
测试脚本。
from __future__ import (absolute_import, division, print_function,
                        unicode_literals)

import argparse

import backtrader as bt
import backtrader.feeds as btfeeds
import backtrader.indicators as btind


class SMAStrategy(bt.Strategy):
    params = (
        ('period', 10),
        ('onlydaily', False),
    )

    def __init__(self):
        self.sma_small_tf = btind.SMA(self.data, period=self.p.period)
        if not self.p.onlydaily:
            self.sma_large_tf = btind.SMA(self.data1, period=self.p.period)

    def nextstart(self):
        print('--------------------------------------------------')
        print('nextstart called with len', len(self))
        print('--------------------------------------------------')

        super(SMAStrategy, self).nextstart()


def runstrat():
    args = parse_args()

    # Create a cerebro entity
    cerebro = bt.Cerebro(stdstats=False)

    # Add a strategy
    if not args.indicators:
        cerebro.addstrategy(bt.Strategy)
    else:
        cerebro.addstrategy(
            SMAStrategy,

            # args for the strategy
            period=args.period,
            onlydaily=args.onlydaily,
        )

    # Load the Data
    datapath = args.dataname or '../../datas/2006-day-001.txt'
    data = btfeeds.BacktraderCSVData(dataname=datapath)
    cerebro.adddata(data)  # First add the original data - smaller timeframe

    tframes = dict(daily=bt.TimeFrame.Days, weekly=bt.TimeFrame.Weeks,
                   monthly=bt.TimeFrame.Months)

    # Handy dictionary for the argument timeframe conversion
    # Resample the data
    if args.noresample:
        datapath = args.dataname2 or '../../datas/2006-week-001.txt'
        data2 = btfeeds.BacktraderCSVData(dataname=datapath)
        # And then the large timeframe
        cerebro.adddata(data2)
    else:
        cerebro.resampledata(data, timeframe=tframes[args.timeframe],
                             compression=args.compression)

    # Run over everything
    cerebro.run()

    # Plot the result
    cerebro.plot(style='bar')


def parse_args():
    parser = argparse.ArgumentParser(
        description='Multitimeframe test')

    parser.add_argument('--dataname', default='', required=False,
                        help='File Data to Load')

    parser.add_argument('--dataname2', default='', required=False,
                        help='Larger timeframe file to load')

    parser.add_argument('--noresample', action='store_true',
                        help='Do not resample, rather load larger timeframe')

    parser.add_argument('--timeframe', default='weekly', required=False,
                        choices=['daily', 'weekly', 'monhtly'],
                        help='Timeframe to resample to')

    parser.add_argument('--compression', default=1, required=False, type=int,
                        help='Compress n bars into 1')

    parser.add_argument('--indicators', action='store_true',
                        help='Wether to apply Strategy with indicators')

    parser.add_argument('--onlydaily', action='store_true',
                        help='Indicator only to be applied to daily timeframe')

    parser.add_argument('--period', default=10, required=False, type=int,
                        help='Period to apply to indicator')

    return parser.parse_args()


if __name__ == '__main__':
    runstrat()
